> ## Documentation Index
> Fetch the complete documentation index at: https://bigbluebutton.com/docs/llms.txt
> Use this file to discover all available pages before exploring further.
# Learning Analytics Dashboard overview
> Moderators use the Learning Analytics Dashboard to monitor real-time student attendance, engagement, and poll responses during a BigBlueButton session.
Moderators use the **Learning Analytics Dashboard (LAD)** to monitor real-time attendance, engagement, and poll responses during a BigBlueButton session. The LAD provides per-user metrics that help educators identify who is engaged, who may need follow-up, and how students are responding to content.
## What the LAD shows
The LAD reports per-user metrics including:
* When each learner joined the session, and whether they are still online.
* How long each learner has been in attendance.
* Who is actively speaking, and for how long.
* Who is sharing a webcam, and for how long.
* Who is messaging, reacting with emojis, or raising a hand.
* How learners answered each poll or quiz.
Moderators can use these metrics to identify absent or disengaged students, prompt encouragement during the session, and review participation after the fact.
## Open the LAD
Once you join a session as a moderator (typically through your LMS), select the gear icon and choose **Learning Analytics Dashboard**.
## Layout overview
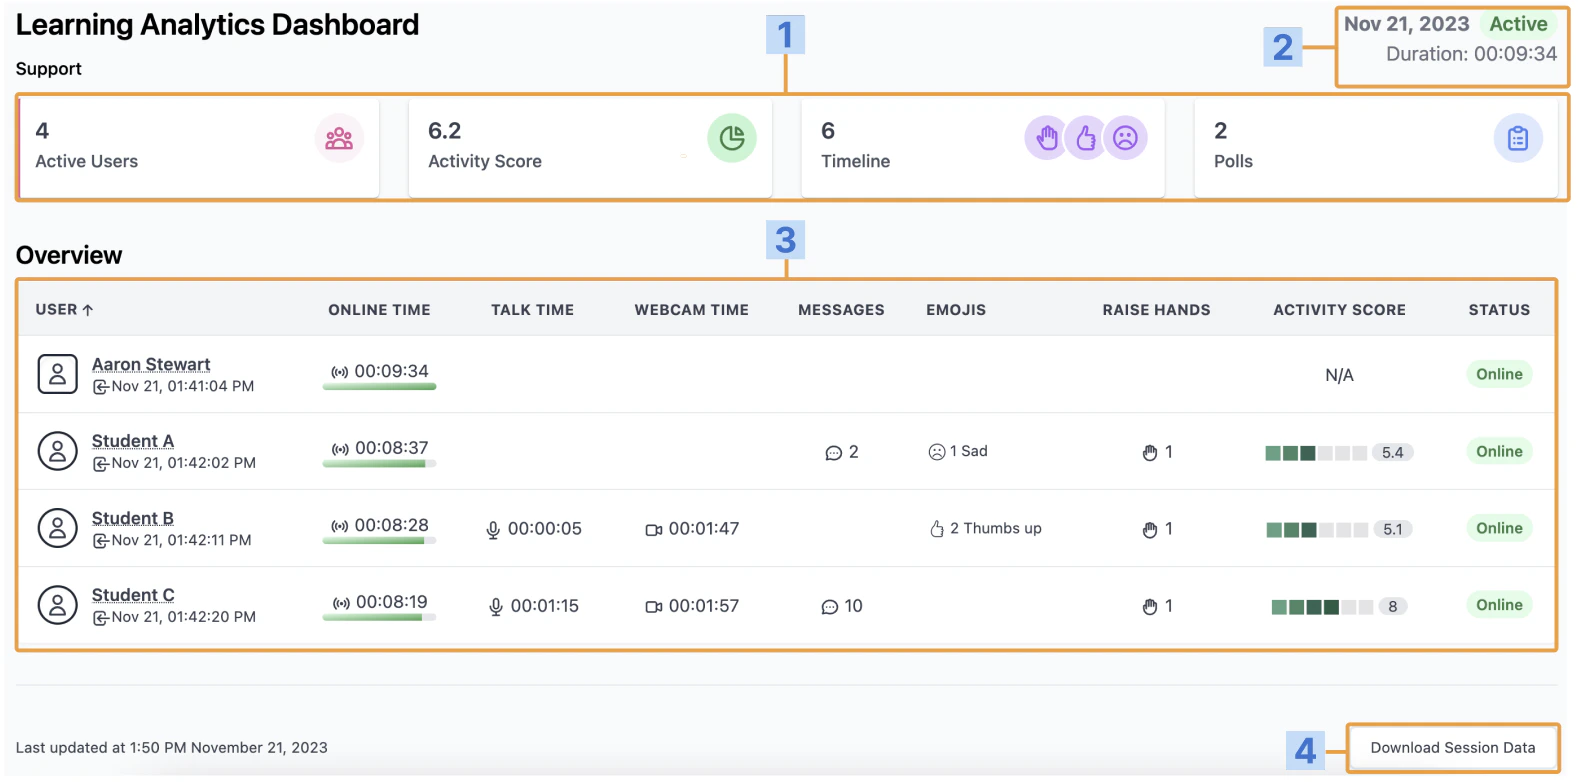
The dashboard has four main areas:
1. A tab list of available views — **User**, **Activity Score**, **Timeline**, and **Polls**.
2. The session overview — date, duration, and whether the session is **Active** or **Inactive**.
3. The per-user table for everyone who attended the session.
4. A button to download the dashboard as CSV.
 ## Per-user details
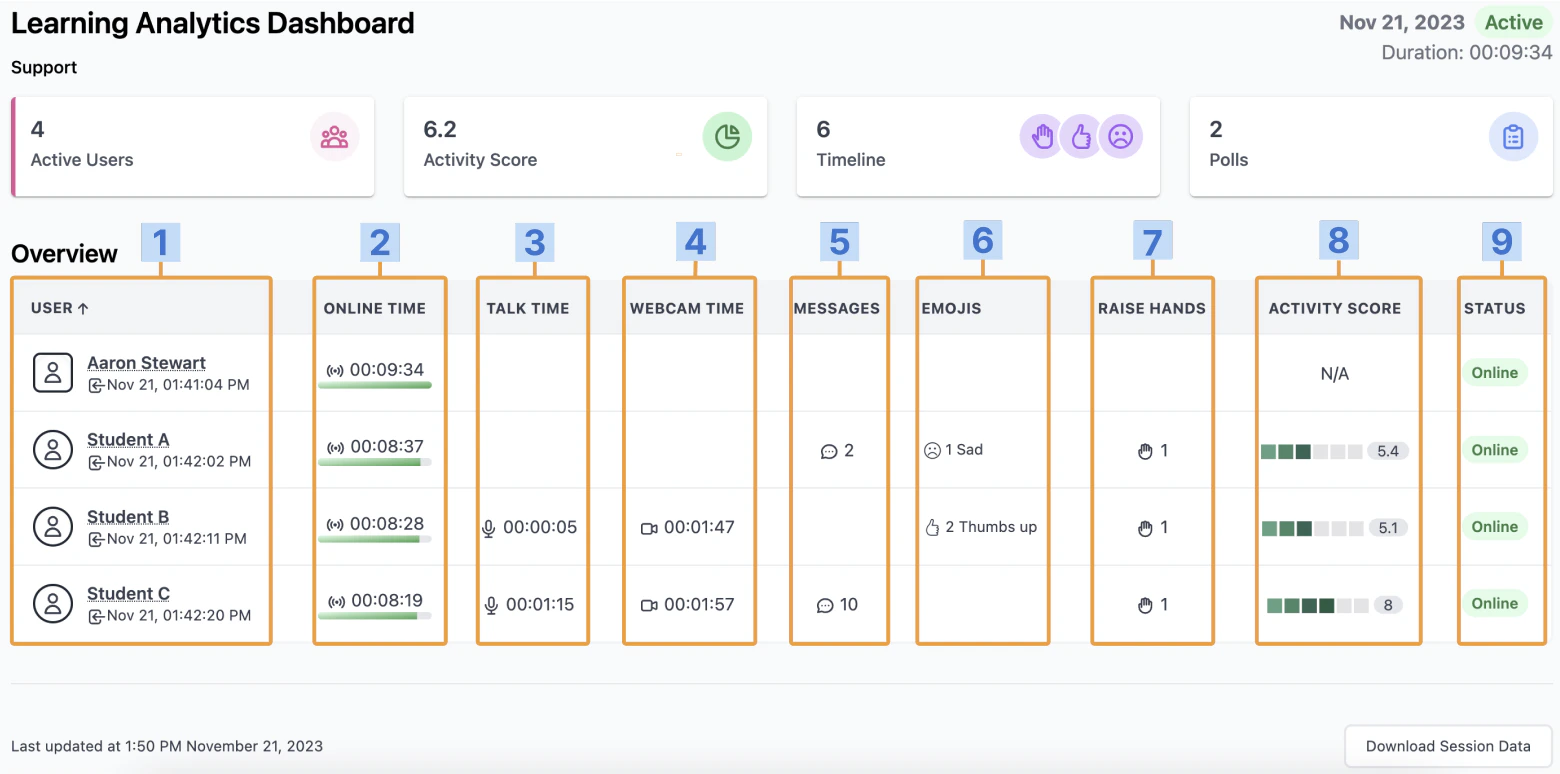
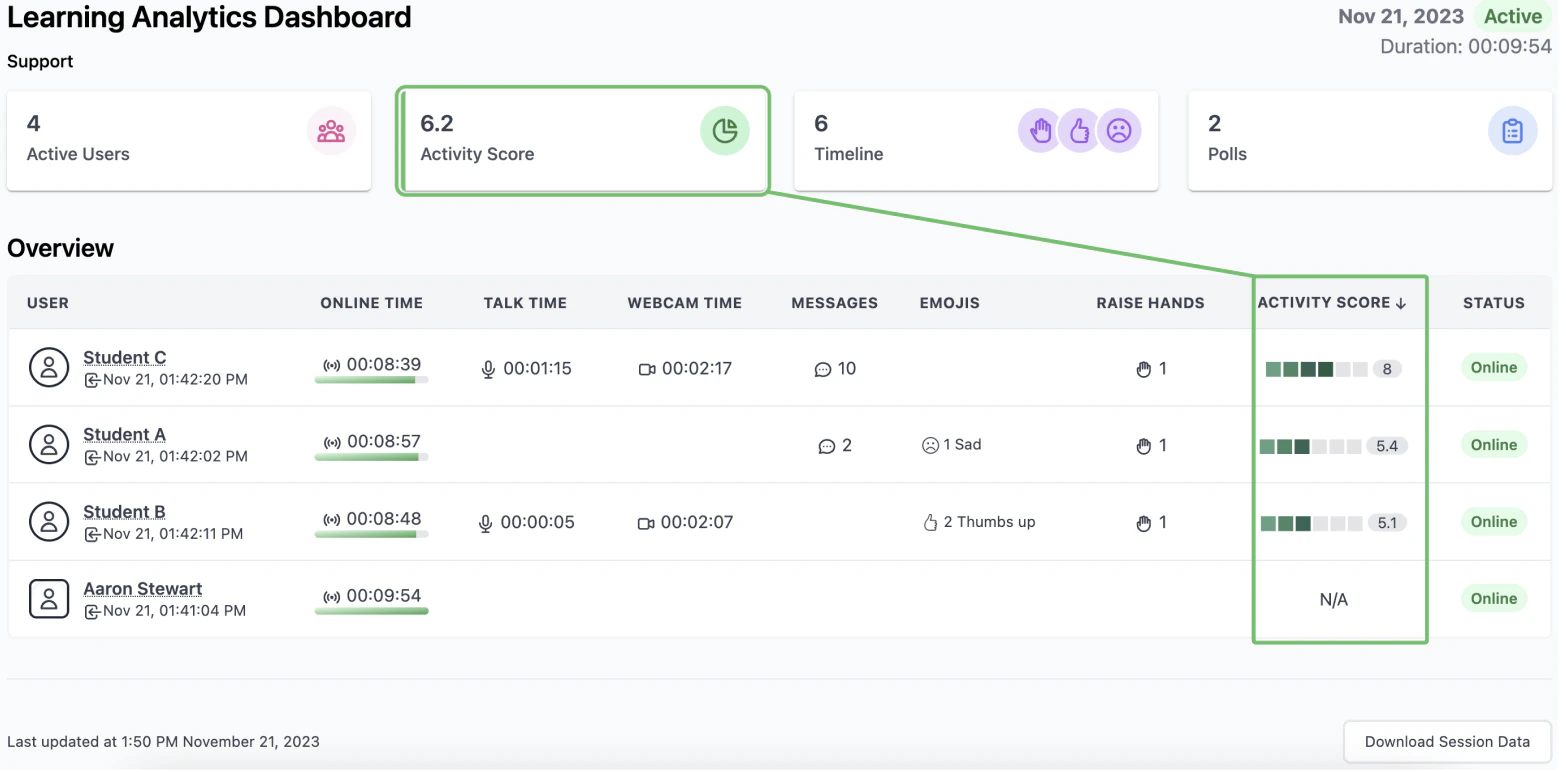
Each row in the user table shows nine fields:
1. User name, plus the time and date they joined.
2. Total online duration.
3. Total time speaking.
4. Total time with webcam on.
5. Number of chat messages sent.
6. Number and type of emoji reactions.
7. Number of times the user raised a hand.
8. Activity score for the session.
9. Current status (online or offline).
## Per-user details
Each row in the user table shows nine fields:
1. User name, plus the time and date they joined.
2. Total online duration.
3. Total time speaking.
4. Total time with webcam on.
5. Number of chat messages sent.
6. Number and type of emoji reactions.
7. Number of times the user raised a hand.
8. Activity score for the session.
9. Current status (online or offline).
 ## Switch views
The LAD provides several views — switch between them using the tabs at the top.
### User view
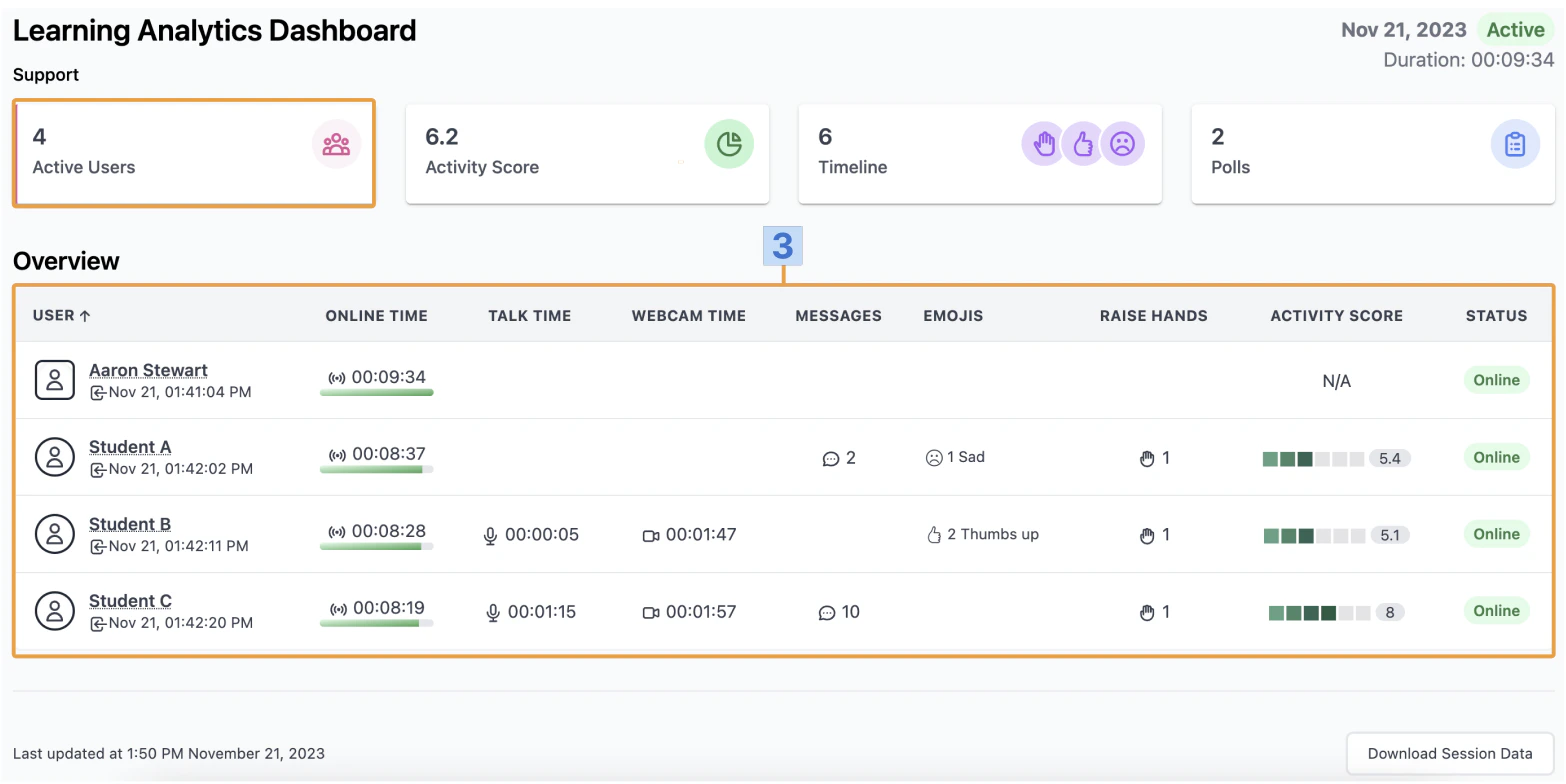
The default view, sorted by join time.
## Switch views
The LAD provides several views — switch between them using the tabs at the top.
### User view
The default view, sorted by join time.
 ### Activity Score view
Sorts users by activity score, highest first. Select the arrow beside the column title to reverse the sort.
### Activity Score view
Sorts users by activity score, highest first. Select the arrow beside the column title to reverse the sort.
 ### Timeline view
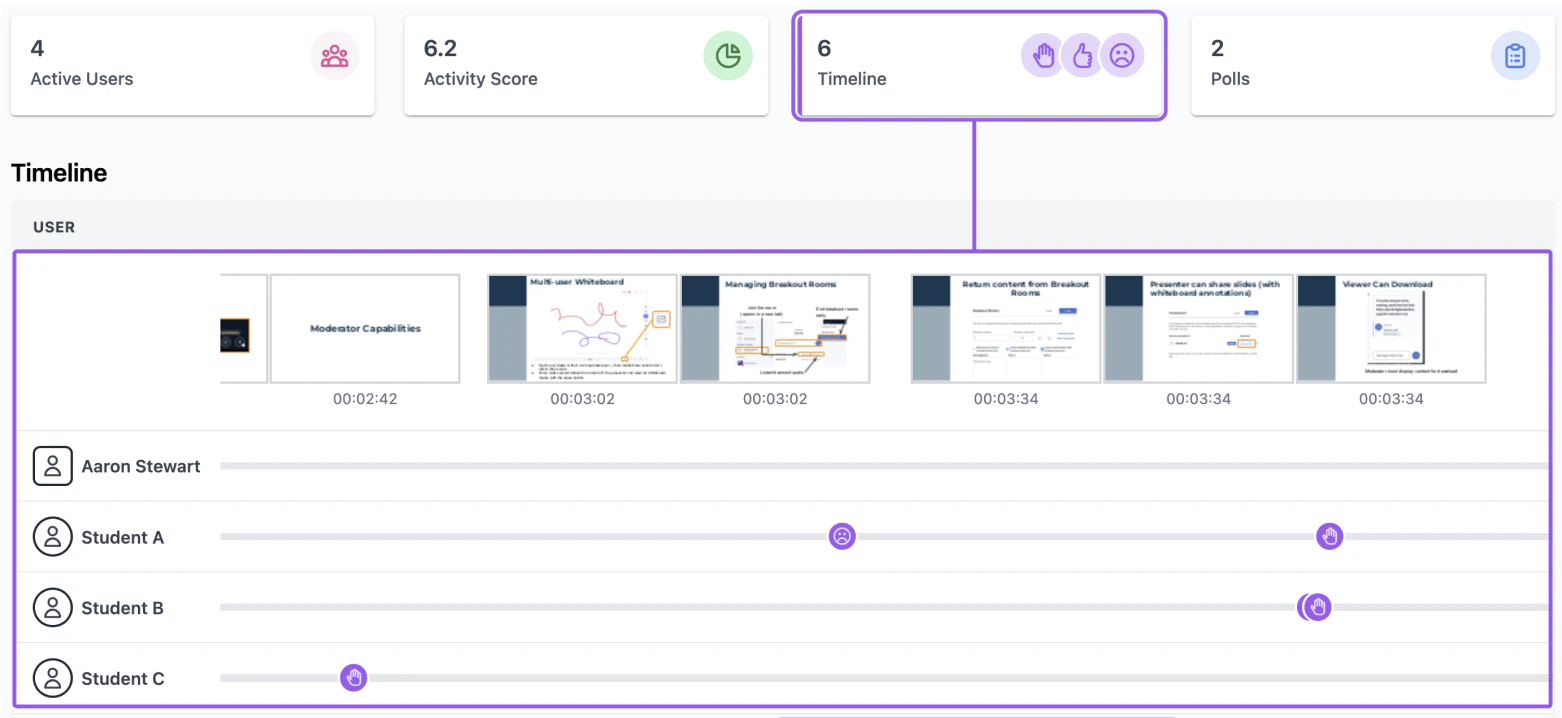
A scrollable timeline of the session. Slides appear along the top with the time they were displayed; users appear along the bottom with any emoji reactions or raised hands. Use this view to see when and how students reacted to specific content.
### Timeline view
A scrollable timeline of the session. Slides appear along the top with the time they were displayed; users appear along the bottom with any emoji reactions or raised hands. Use this view to see when and how students reacted to specific content.
 ### Poll view
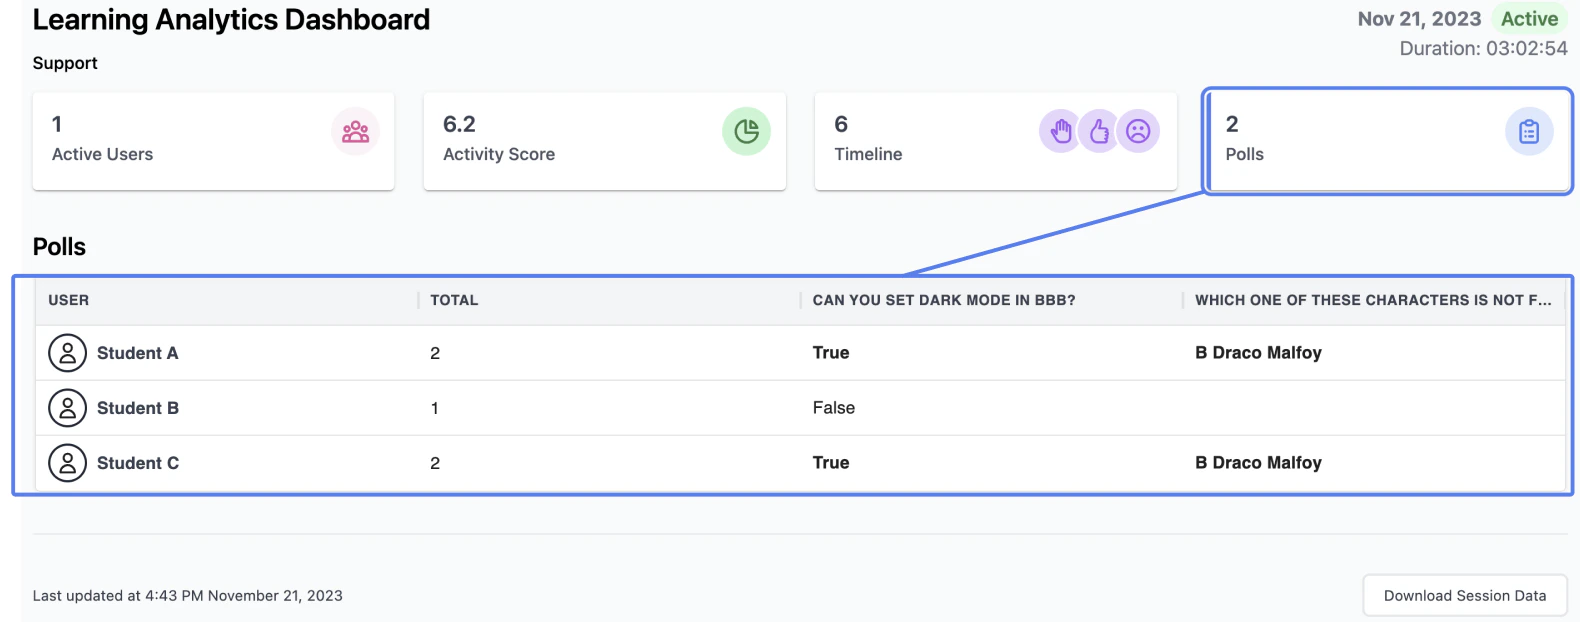
Lists every poll question along with student answers and the most popular response.
### Poll view
Lists every poll question along with student answers and the most popular response.
 ### Individual view
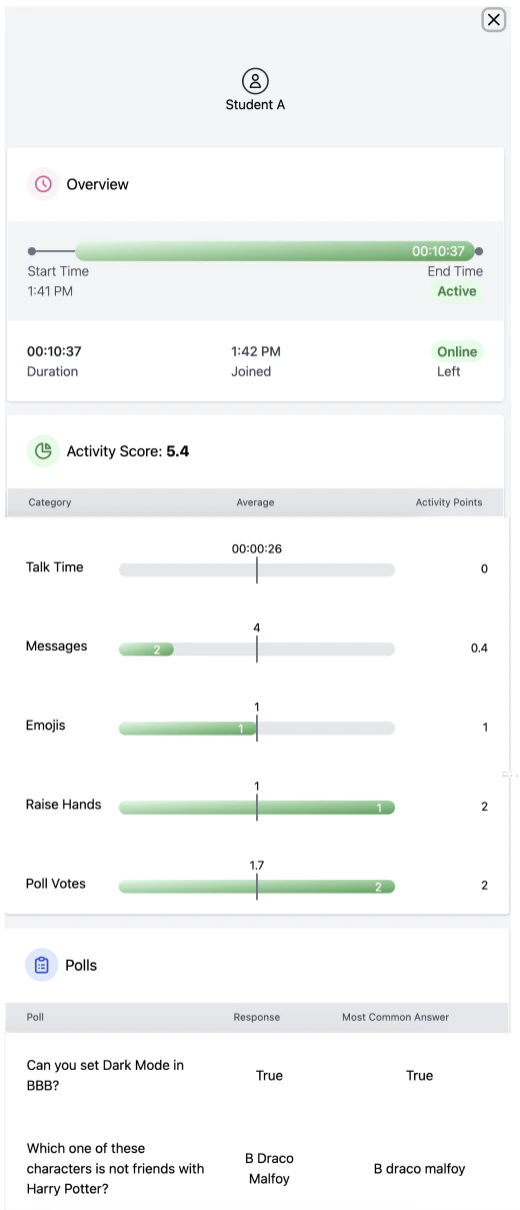
Select a user's name in any view to open their individual overview, which gathers all of that user's metrics in one place.
### Individual view
Select a user's name in any view to open their individual overview, which gathers all of that user's metrics in one place.